Data Visualization & Maps
Cambridge Dogs
Visualizing most frequent dog “Name” or most frequent “Breed” in each Cambridge, MA neighborhood on an interactive SVG map. Hover or tap a neighborhood to see the top three values. Built with Vite, D3 v7, and SVG textPath.
VisitRepo
Vite
JavaScript (ESM)
D3 v7
SVG
topojson-client
CSS
ArcGIS FeatureServer
Contributions by Zip3
Single‑page visualization focused on contributions with two interactive views: ZIP3 choropleth (default) for spatial distribution across Wisconsin ZIP3 regions & Payment Method view (donut chart) showing share of total by payment type
VisitRepo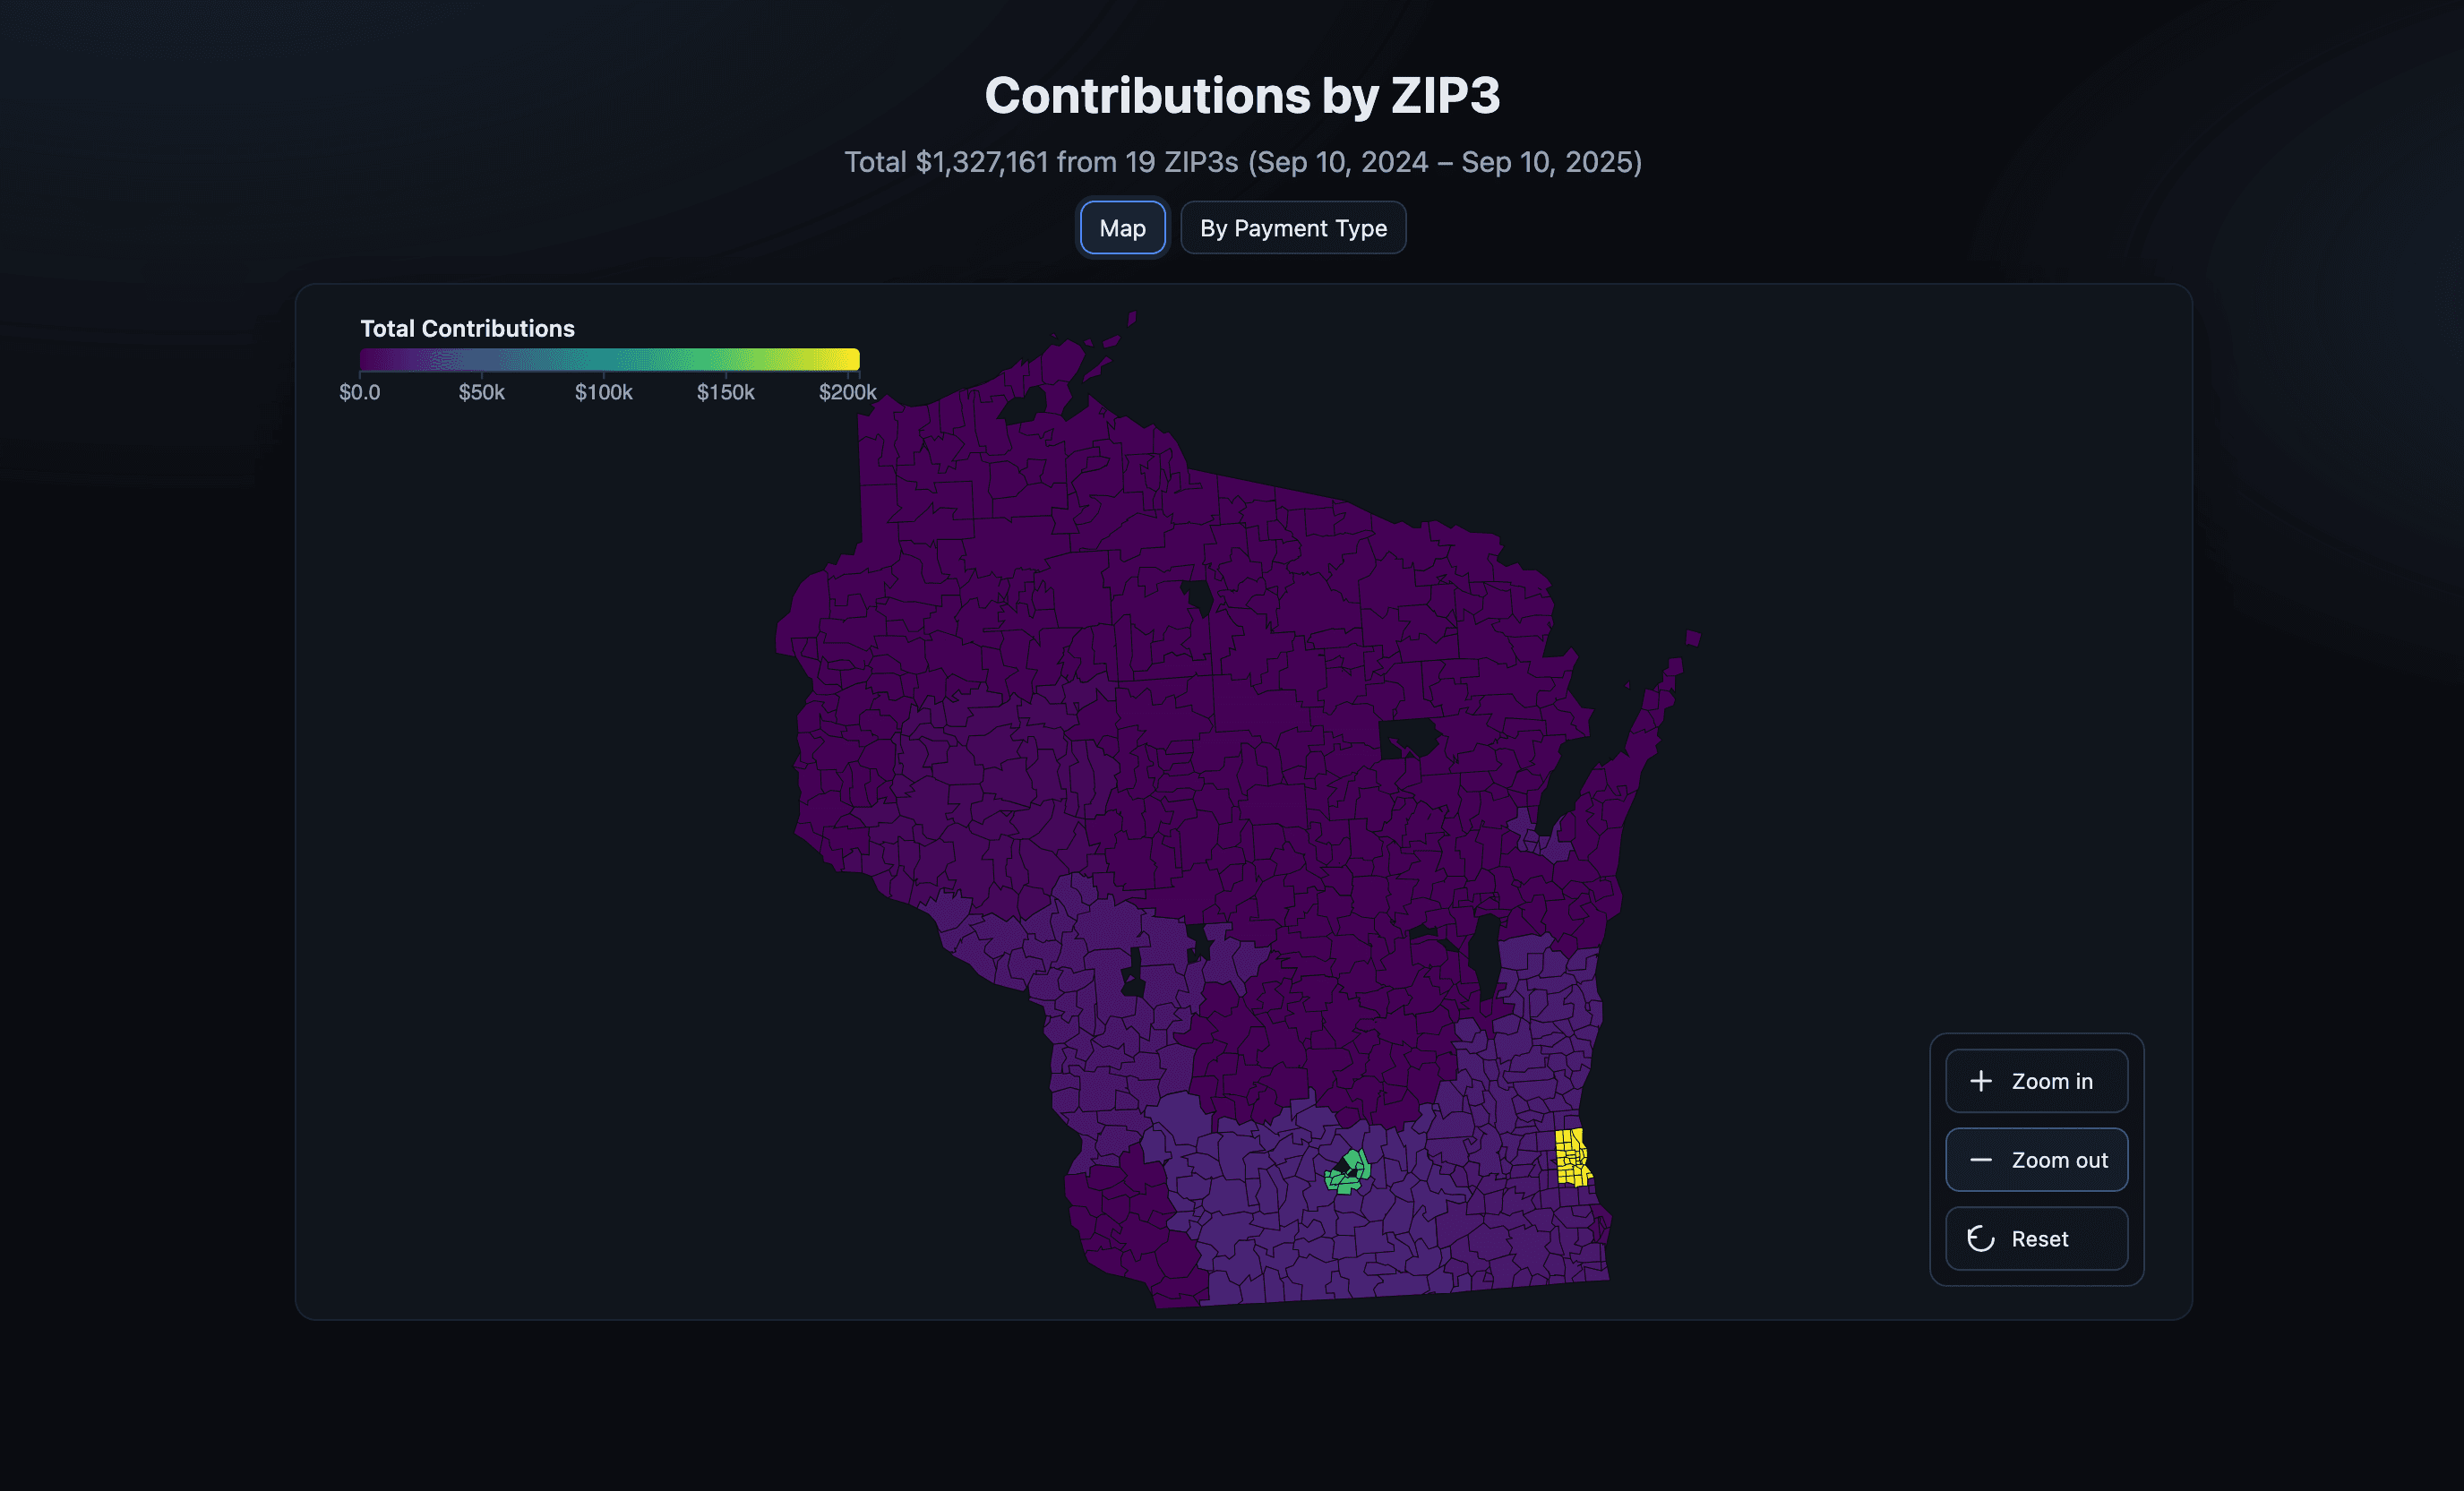
D3.js
Vite
Choropleth Map
Data Visualization